The Weekly · Free · Wednesdays
One idea. Empirical evidence. Weekly.
A short research letter by Iván Blanco, founder and CIO of Noax Capital. How the live strategy did last week, one idea drawn from decades of institutional data (with the chart to back it), and the best of what he has been reading on systematic investing and asset pricing.
Research publication, not investment advice. We measure which links are clicked to understand what readers find useful; we do not track opens. Unsubscribe anytime. Privacy.
LIVE TRACK RECORD
Updated weekly · IBCumulative return, net, since inception · shown at 2× gross leverage
··.·%
Ann. return
··.·%
Volatility
··.·%
Corr. S&P 500
·.··
What's inside
Last week at Noax
WTD, MTD, YTD and Sharpe of the live strategy, from the same data feed as this site. Red weeks included.
Full transparency. Follow the track before you commit.
The chart of the week
One original chart built from institutional data (CRSP, Compustat/WRDS, FactSet), with decades of history you will not find on a free terminal, and 150 words on why it matters now.
One paper worth your time
From the week's systematic-investing research, with an opinion, not a summary.
Two market stories
One from the quant world, one from the broader market. Two lines each.
Recent charts of the week
The kind of chart our readers get, every week
A century of momentum, and the price of holding it
The US momentum factor since 1927. A dollar grew to $355, about +6.1% per year, and the factor sits 32% below its peak.
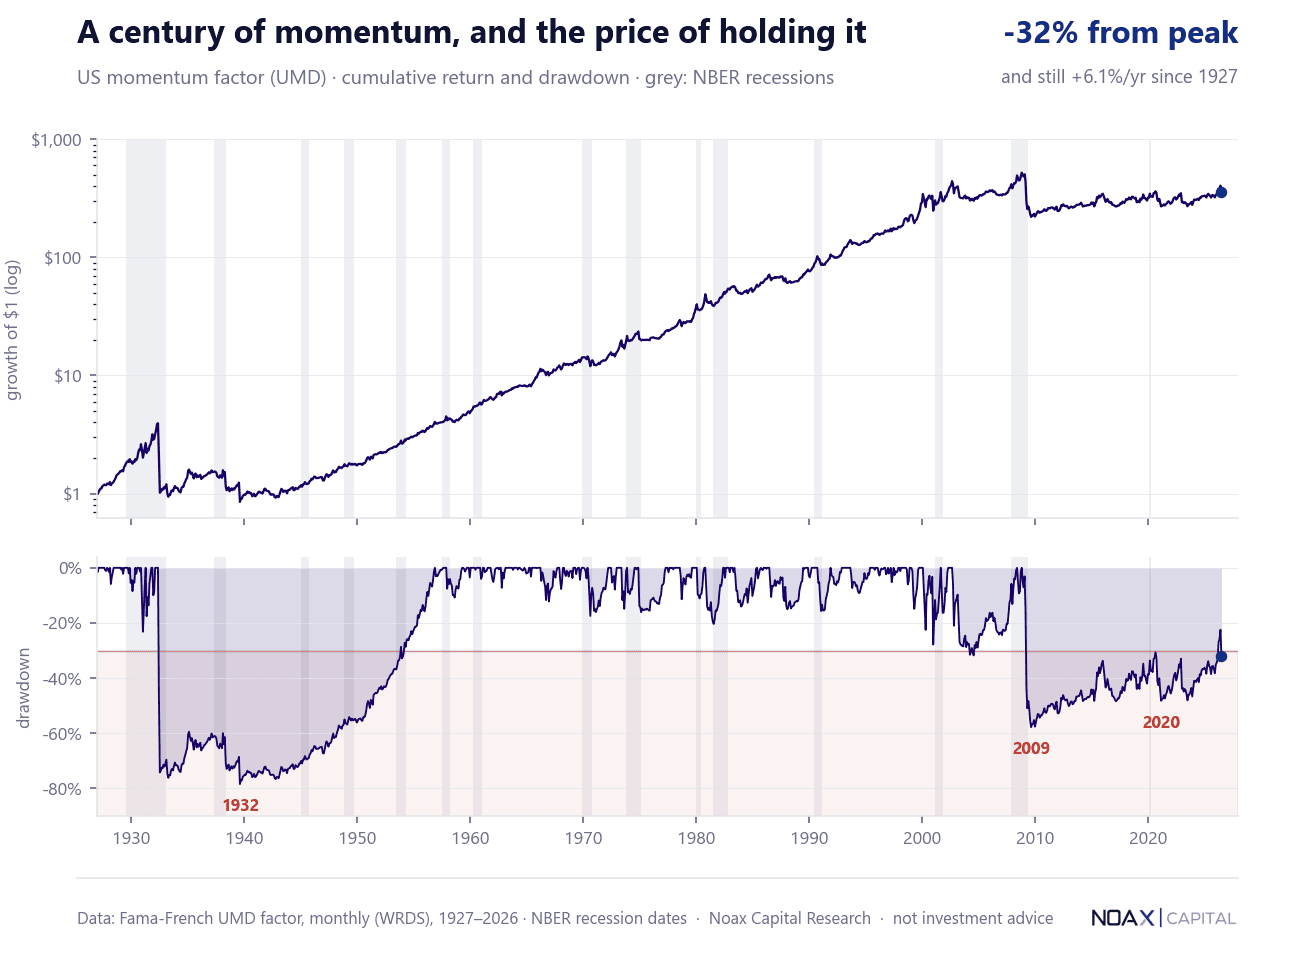
Data through July 2026. Fama-French momentum factor (WRDS), NBER recession dates.
The 60/40's quiet problem
The stock-bond correlation sits at +0.40, above anything in two decades. At this level bonds do not dampen equity drawdowns. They join them.
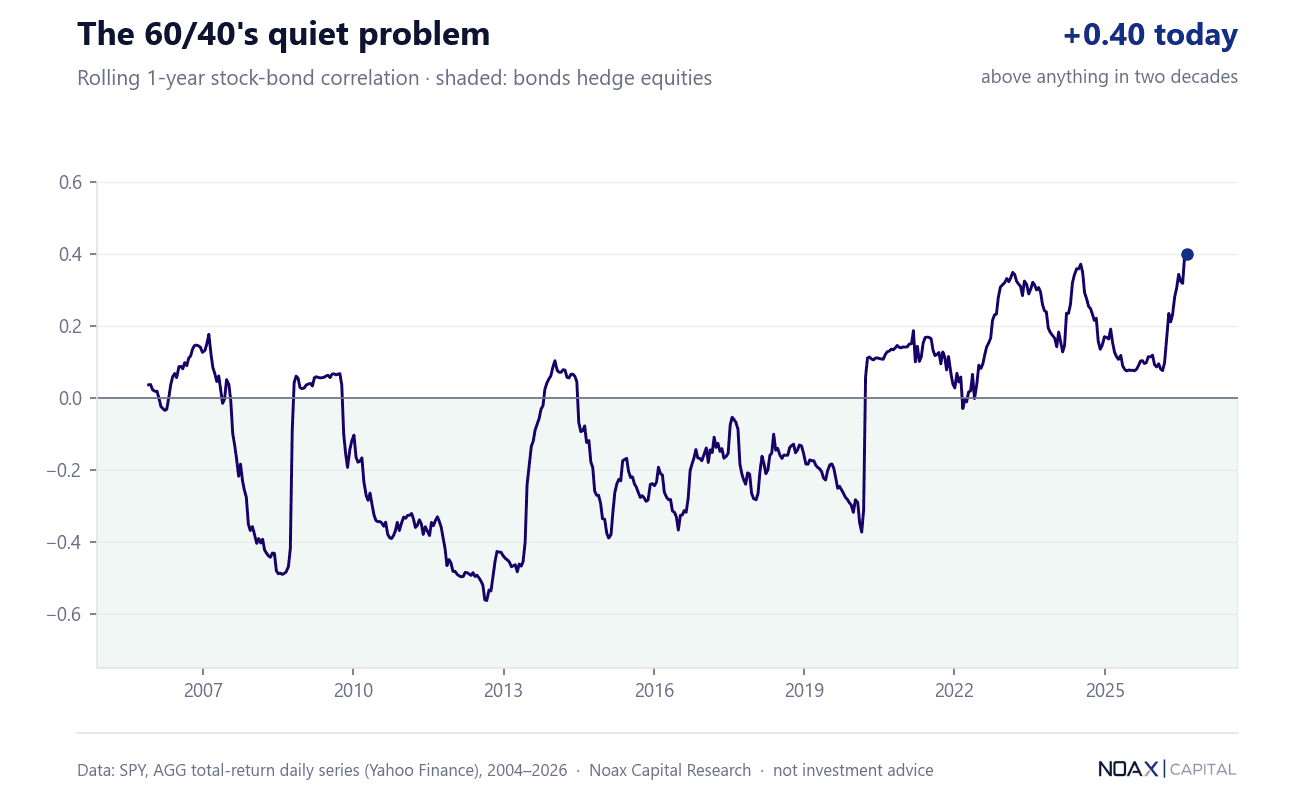
SPY and AGG total-return daily series, 2004–2026.
Sample issue charts. Not investment advice.
Get the next issue
Free, every Wednesday morning. Written by the person who runs the strategy, with the same numbers the live track record shows.